Why Our Work Matters
Research & Data
The importance of good data in achieving equitable education systems
Good data are the common language that we can all use to ensure every kid has the opportunity for a high-quality education, and evaluate what’s working in our education systems. We have several tools available for to ensure sound data is equitably available and easily accessible for the community.
School Scout Nevada Data Portal

If you are looking to find out how schools in your neighborhood are performing, visit our school performance data portal. The data portal provides an easy way to look up and compare schools, find resources important to you, and equip you for conversations about school performance – whether you’re a parent or guardian, community member, employer, or elected official.
Priority Footprint Map

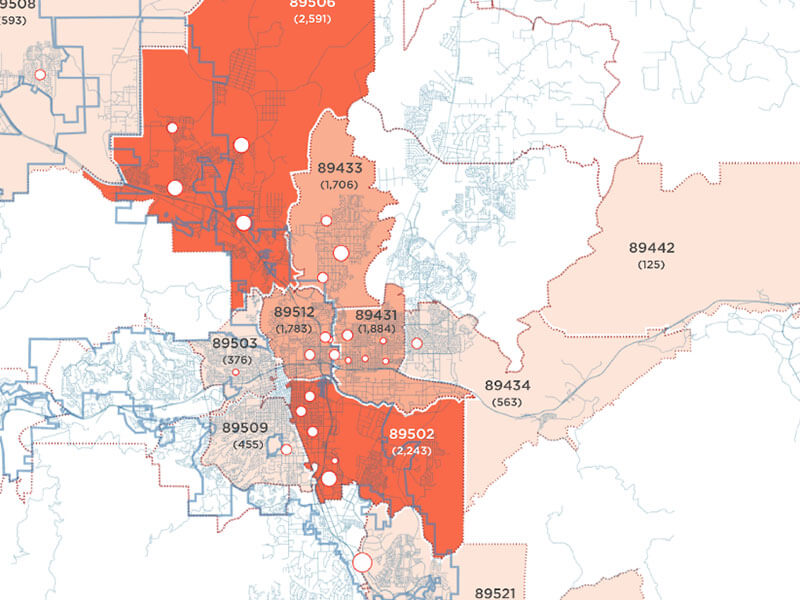
Opportunity 180 created the Priority Footprint Maps in an effort to focus our work where there is the greatest need. The map below highlights all Nevada zip codes with the highest concentration of elementary students attending low-performing schools (i.e. schools that received a one- or two-star rating on the Nevada School Performance Framework).
Visit our interactive school quality map to see where the highest- and lowest-performing public schools in Nevada are located. This map may be useful to:
- School leaders looking to open or expand a school in Nevada
- Families looking for more information about schools in their area
- Elected officials wanting to see the distribution of school performance in their their district
- Anyone interested in exploring the areas of greatest educational opportunity in our community
Explore Priority Footprint Maps for Clark County’s Elementary Schools, Middle Schools, and High Schools.
Explore Priority Footprint Maps for Washoe County’s Elementary Schools, Middle Schools, and High Schools.
Research & Studies to Explore
50CAN: The State of Educational Opportunity in America: A Survey of 20,000 Parents
Explore the Nevada results and how we, as a state, compare to the rest of the country in five categories: school quality and opportunity; tutoring, summer and mental health; out-of-school activities; information and engagement; and college and career readiness. Read More
TNTP: The Opportunity Myth
“We’ve been telling students that doing well in school creates opportunities—that showing up, doing the work, and meeting teachers’ expectations will prepare them for their futures. Unfortunately, that’s a myth.” Read More
Brookings Institution: College Enrollment Disparities: Understanding the Role of Academic Preparation
“We find that college enrollment gaps by socioeconomic status, gender, and race are significant, and that gaps are much smaller and sometimes reversed among students with similar academic preparation. Our results suggest that policymakers and researchers interested in addressing college enrollment disparities should pay careful attention to disparities in academic preparation during elementary and secondary education.” Read More
Fordham Institute: The Power of High Expectations in District and Charter Schools
“Are we really helping students by lowering the bar? What sorts of expectations should teachers set as they begin to dig out? And what can research and prior experience—particularly from the charter sector, where the need for high expectations has long been a rallying cry—teach us about how to approach this monumental challenge?” Read More
Boston University Wheelock Policy Center: The Effect of Retention Under Mississippi’s Test-Based Promotion Policy
“Our results are generally promising for the effects of test-based retention as implemented in Mississippi. We find large positive impacts from retention on student ELA achievement, which is the policy’s primary goal.” Read More